NetVis
Visualization tool enabling multiple perspectives of network traffic data using pcap.
Description
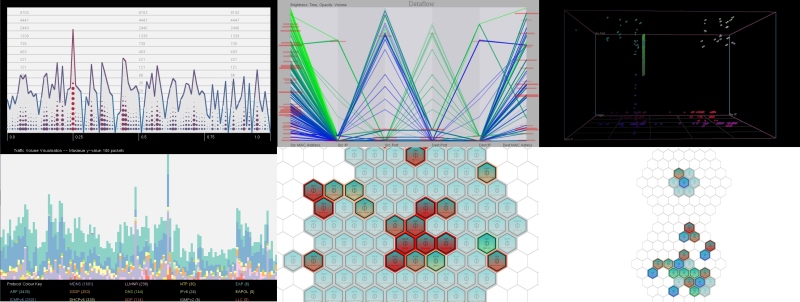
Netvis is a visualisation tool which allows an analyst to detect network attacks in real time. It uses a novel framework designed to support multiple heterogeneous visualisations of traffic data concurrently. Due to the modular nature of the system, a user can investigate on-going activity, or any subset of it, at their pace and based on their priorities for further exploration.
Motivation
The original motivation for this project was to complete a second-year group project for the University of Oxford computer science degree. I was allocated four colleagues at random and we were given around 8 weeks to complete a project of our choice.
Our project turned out to be a great success and we won a cash prize from IBM; our sponsor suggested that our work was of such value that we ought to write a research paper. The resulting paper, NetVis: a visualization tool enabling multiple perspectives of network traffic data, was accepted to Eurographics UK TP.CG.2013 and three of us presented it at the University of Bath in September 2013.
Contribute
NetVis is licenced under the GPL, and available on Github. It doesn't have a lot of interest at the moment, but feel free to contribute and make it your own.